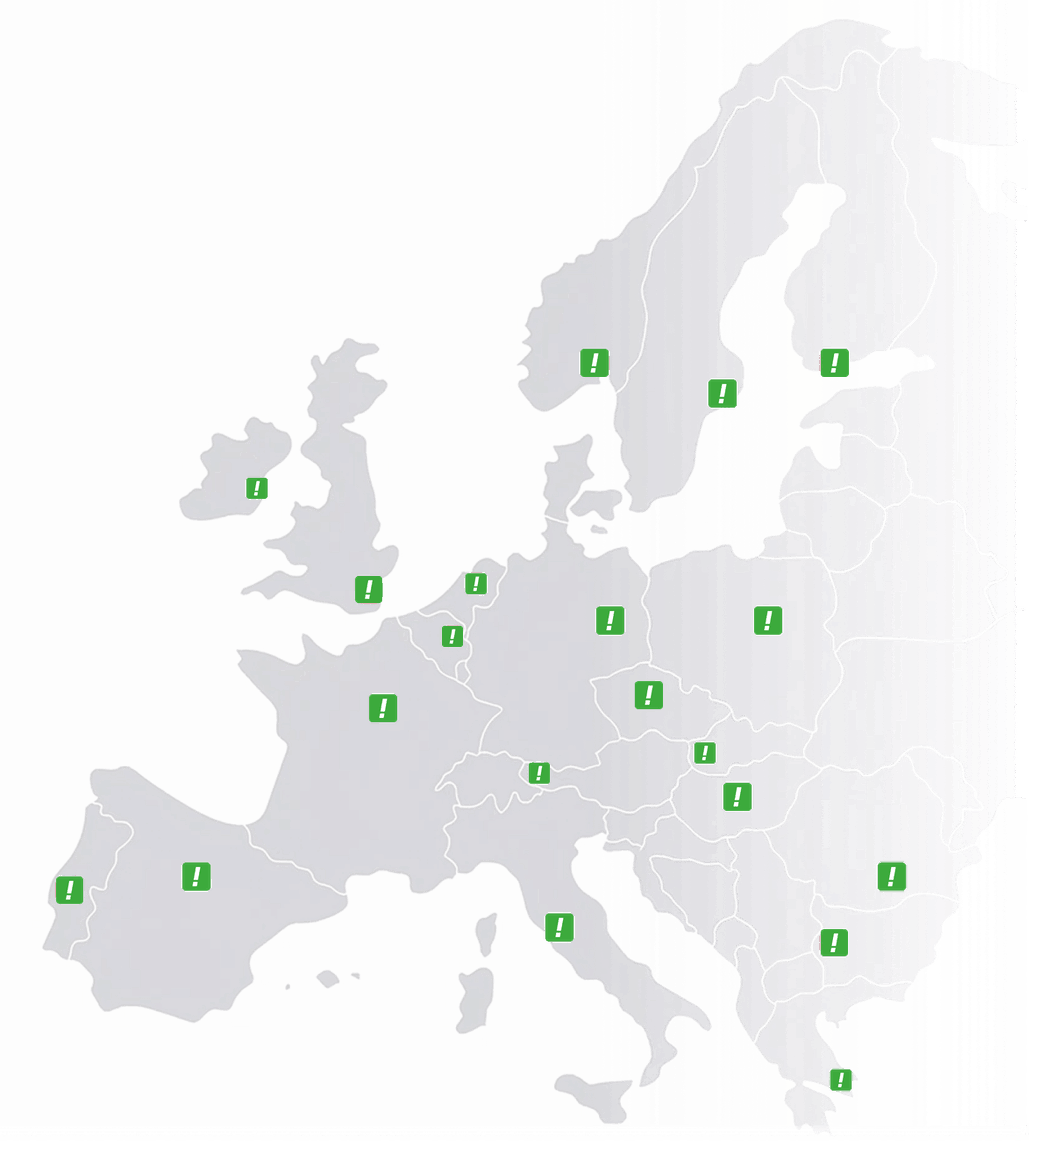
Austria
 Belgium
 France
 Germany
 Italy
 Netherlands
 Poland
 Spain
 Sweden
 United Kingdom
 United States
Call statistics: who called, when, and which calls you missed
Every missed call was someone who wanted something from your business. Call insights shows how many there were, when they rang and whether it happens every Tuesday morning, so you can plan your staffing on figures.
Call history up to one year, per number, per office and per hour of the day.

Peter sees when his customers call
In the dashboard Peter sees who called, when, for how long and where the call went. He also receives the overview by email every day and every week, so he knows when extra people are needed.
- Who called, when and for how long
- Where the call went
- Daily and weekly by email
Three questions call statistics answer
The phone is often the one channel where nothing is measured by default. Call insights answers the questions that decide your staffing.
When do you need people at their desks?
You know that mornings are busy, but not whether the peak is at nine or at eleven. Without figures, the rota is based on a feeling rather than on the hour when most people call.
How are calls spread across offices and teams?
With several offices or teams you can’t see who handles the most calls. One location is overloaded while the other has room to spare, and both are sure they are the busiest.
Did a campaign lead to more calls?
If you advertise in a region, the number of calls shows whether more people rang, and for landline callers also the town they called from. Many businesses only measure online, while customers often respond by phone.
Call statistics in the dashboard, by email or through the API
Few people log in to a dashboard every day. That is why the same data reaches you in three ways, and most businesses use all three.
The dashboard
Choose a period (today, this week, this month or a range of your own) and see your totals, your peak hours and your top ten destinations, callers and caller towns straight away.
A report by email
Daily, weekly or monthly, set per number. The support line can send its figures to the operations manager every day, while the main number sends management a summary once a month. If you have several numbers, each one sends its own report.
Export and API
Download all call data from the dashboard as a CSV file that opens in Excel, or pull it into your own reports through the API, so your phone figures sit alongside your other business figures.
Missed calls are the figure to watch first
Of everything you can measure, one figure costs you money directly: the number of callers who weren’t helped. The other figures help explain that one.
Missed calls per hour and per line
You see how many calls were missed, and also when and where. Five missed calls spread over a week is not the same as five on a Tuesday morning between nine and ten, and the second you can solve with a change to the rota.
Calls and missed calls per office
With a central number that routes to several offices or franchisees, you see per location how many calls come in and how many are missed. That turns a discussion about staffing into a discussion about figures.
Caller towns show the effect of a regional campaign: if you advertise in Munster, it should show up in your list of towns. The town comes from the area code, so it only appears for callers on a landline. If most of your callers ring from a mobile, the number of calls is your signal, not the town.
Call insights settings: period, reports and export
The period
up to one yearToday, this week, this month or any range you choose within the past year. Useful for comparing a busy week with a quiet one, or this month with the months before.
Who gets which report
per numberYou set an email address and a frequency (daily, weekly or monthly) for each number, so every number can report to a different person at its own rhythm.
Each number separately
per numberEvery number has its own figures, so a number per office, per country or per campaign shows its results separately.
Where the figures go
CSV or APIView them in the dashboard, download them as a CSV file or pull them into your own reports through the API.
What call statistics don't tell you
The figures tell you what happened, not why. You see straight away that seventeen calls were missed on Tuesday morning, but not whether that was down to sickness, a campaign or too few people on the rota. A dashboard that nobody opens changes nothing, which is why the email report is often the most useful part.
Included in every plan, even for one person
Call insights is included at no extra cost in every plan, from Business Number to Customer Service, and you can look back at your call history for up to one year.
Questions about call insights

Rather talk it through first?
Our team helps you with numbers and voicebots in every country we cover. Call us or use the contact form.
To the contact form → Call us 1800 816 446Up to one year. That is enough to compare this month with the months before, or a busy week with a quiet one, and to see whether a change to your rota made a difference.
Yes. With a central number that routes to several offices, the list of destinations shows how many calls come in per location and how many are missed.
No, not necessarily. You set the report per number, with its own email address and frequency. The line a team works from can report every day, while the main number sends a monthly summary to whoever only wants to see the trend.
Yes. You download all call data as a CSV file, or pull it into your own reports or dashboard through the API.
Yes, for landline callers, at town level in a top ten. The town comes from the area code, such as 021 for Cork or 091 for Galway, and a mobile number doesn’t have one: 087 says nothing about where someone is. Business callers more often ring from a landline, so for them the list is more complete.
Every call is logged with the caller’s number, the date and time, the length of the call and the route it took. You also see missed calls, peak hours and your most frequent callers.
Yes. You set up automatic email reports per number, daily, weekly or monthly, so the figures arrive in your inbox without you having to log in.
Yes. You give each campaign or media channel its own number, and call insights shows which one brings in the most calls. That tells you which advertising works by phone.
No. Call insights is part of every plan, from Business Number at €149 a year to Customer Service, at no extra cost.
Start with your missed calls
Choose a week and see how many calls went unanswered and at what time. That one figure is usually enough to show what needs to change.